Data and analysis conditions
This analysis is based on public API order book data collected under the following conditions.
| Item |
Detail |
| Instruments |
Three BTC/JPY spot order books: bitbank btc_jpy / bitFlyer BTC_JPY / Coincheck btc_jpy |
| Period |
2026-09-09 20:35:56 – 2026-09-11 20:35:46 JST (47.997 hours common to all three, Wednesday evening to Friday evening, no weekend). The order book APIs return only the book at the moment of the request, so observation starts when collection started |
| Interval |
10 seconds. Expected snapshots: 17,280 per venue (48 hours at 10-second intervals) |
| Order book source |
Each venue's public REST API (bitbank GET /btc_jpy/depth, bitFlyer GET /v1/board?product_code=BTC_JPY, Coincheck GET /api/order_books). Levels stored exactly as each API returned them |
| Direction |
Buys only (consuming the ask side from the cheapest level). Sells (consuming bids) not calculated |
| Effective price |
VWAP(N) = Σ(price × size) / Σ(size): the weighted average price of consuming ¥N of asks from the cheapest level, using only the remainder of the last level. VWAP stands for volume-weighted average price |
| Primary metric |
Deviation from best ask: dev_best_bps = (VWAP(N) − best_ask) / best_ask × 10,000. All bps figures in the text are this value |
| Secondary metric |
Deviation from mid: dev_mid_bps = (VWAP(N) − mid) / mid × 10,000, where mid is (best_ask + best_bid) / 2 before level exclusion. Used only to connect with a separate article on round-trip effective spreads |
| Size ladder |
¥10M / ¥30M / ¥50M / ¥100M (all three) + ¥200M / ¥500M (only where computable) |
| Excluding unfillable levels |
Levels more than ±10% from mid are excluded and counted. Zero-size levels are dropped and counted |
| Invalid snapshots |
Books that are crossed (best_bid ≥ best_ask), have a quoted spread (best ask minus best bid, divided by mid) above 1,000bps, have an empty side, or contain non-finite values are excluded |
| Fill rate and display rules |
Fill rate = share of snapshots in which the returned book (after exclusions) reached ¥N. 90% or more is "full" and a value is shown; 50–90% is "partial" and only the fill rate is shown; below 50%, no value. No value is shown for fewer than 21 samples. Values from books that do not fill are not included in the distribution |
| Fees and FX |
Fees excluded. No FX, as everything is in JPY |
| Statistics |
Median / p25 / p75 / p95 / maximum. p25, p75 and p95 are the 25th, 75th and 95th percentiles (linear interpolation). bps and multiples to 2 decimal places, fill rate to 4, yen to whole numbers |
| Valid snapshots |
bitbank 17,274 / bitFlyer 17,274 / Coincheck 17,279 |
Valid snapshots number 17,274–17,279 across the three venues. Gaps and the books excluded as invalid are detailed in the notes *3. The raw data are order book snapshots from the three venues' public APIs, aggregated in code *4. The rules for cleaning the book, fill rate and sample size are the same as in a separate article on domestic and offshore round-trip effective spreads; no thresholds were created specifically for this article *5.
Only for bitFlyer can primary sources show that a 10-second interval (30 requests per 5 minutes) is within the official rate limit (its HTTP API allows 500 requests per 5 minutes per IP address). The documentation for bitbank and Coincheck does not state a rate limit for their public APIs.
How much of the book the public APIs return
Of the three venues, only bitbank fixes the number of levels its public API returns in its official documentation. Since this matters before comparing depth, we set it out first.
| Venue |
Levels stated in documentation |
Ask levels observed (min / median / max) |
| bitbank |
Stated as 200 each. Original: "Asks and bids data is restricted to 200 entries each from best bid offer" |
200 / 200 / 200 |
| bitFlyer |
Not stated. The only query parameter is product_code; neither the Japanese nor the English documentation mentions a level limit, a depth setting, or returning the full book |
1,194 / 1,346 / 1,436 |
| Coincheck |
Not stated. The description is only "Fetch order book information." and the only parameter is pair |
200 / 200 / 200 |
bitbank returns "200 levels each by specification". Coincheck "always returned 200 levels during the observation period, but this is not in the specification", so it cannot be determined whether 200 is the API's limit or the end of the book. bitFlyer states no level limit and returned 1,194–1,436 ask levels during the period. The official documentation does not confirm whether the returned book contains every order, so for bitFlyer we show only the measured levels and notional, not the whole book.
Effective price deviation by order size
For BTC/JPY market buys from ¥10M to ¥100M, the median deviation of the effective price from the best ask went from 3.67 to 80.66bps on bitbank, 1.48 to 8.61bps on bitFlyer and 9.24 to 117.49bps on Coincheck *1. Consuming more of the same book cannot lower the weighted average price, so deviation rising with size is true by definition. What this analysis looks at is how it rises, and how that shape differs between venues.
The table shows the median deviation from the best ask, in bps. One bp is 0.01%; on a ¥100M order, 100bps is a ¥1M difference.
| Order size |
bitbank (bps) |
bitFlyer (bps) |
Coincheck (bps) |
| ¥10M |
3.67 |
1.48 |
9.24 |
| ¥30M |
15.27 |
2.89 |
25.23 |
| ¥50M |
25.45 |
4.35 |
46.44 |
| ¥100M |
80.66 |
8.61 |
117.49 (fill 99.98%) |
| ¥200M |
— (fill 84.21%) |
39.15 |
— (fill 0.38%) |
| ¥500M |
— (fill 0%) |
237.88 |
— (fill 0%) |
Cells without a fill rate are 100%. "—" marks cells with a fill rate below 90%, where no value is shown *2. bitbank's ¥200M filled in 84.21% of snapshots, but the distribution of only the books that filled is biased downward, so it is not shown as a level.
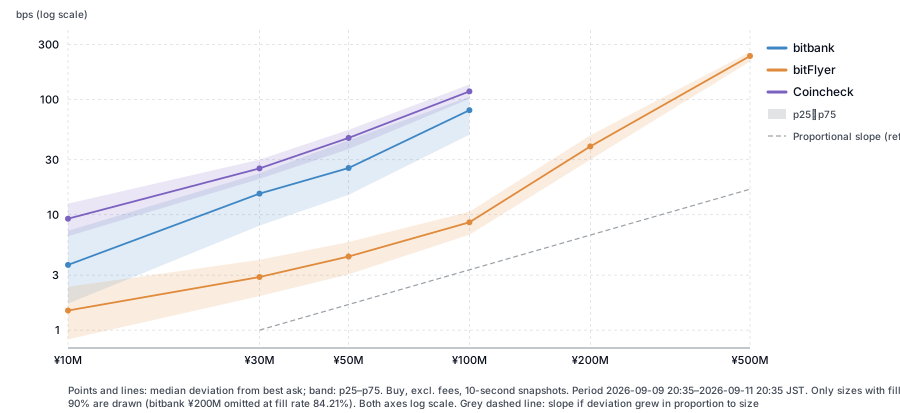
bitFlyer's ¥200M and ¥500M could be computed at a 100% fill rate, with medians of 39.15bps and 237.88bps. bitbank and Coincheck have no comparable values at those sizes. Multiples from ¥100M to ¥200M and from ¥200M to ¥500M were not calculated, so the values are simply listed.
A like-for-like comparison of the three venues at ¥50M and ¥100M
Among the sizes computable at a 90%+ fill rate on all three venues, ¥50M and ¥100M are the ones most often estimated in practice. Median deviations were bitbank 25.45bps / bitFlyer 4.35bps / Coincheck 46.44bps at ¥50M, and bitbank 80.66bps / bitFlyer 8.61bps / Coincheck 117.49bps at ¥100M *1. Coincheck's ¥100M fill rate was 99.98% (17,276 / 17,279); all others were 100%.
Beyond the median, here is the spread. At ¥50M, p25 / p75 / p95 were bitbank 14.89 / 44.34 / 62.86bps, bitFlyer 3.04 / 5.81 / 8.60bps and Coincheck 37.14 / 54.55 / 67.04bps. At ¥100M they were bitbank 49.44 / 105.49 / 131.75bps, bitFlyer 6.71 / 10.63 / 18.69bps and Coincheck 101.45 / 134.84 / 165.13bps. Even within the middle 50% of observations, bitbank's ¥100M deviation ranged from 49.44bps at p25 to 105.49bps at p75.
To connect these figures with the separate article on round-trip effective spreads (measured from mid), use the secondary metric, the deviation from mid. Median deviations from mid at ¥100M were bitbank 80.80bps / bitFlyer 10.12bps / Coincheck 118.19bps, and at ¥10M bitbank 3.78bps / bitFlyer 3.05bps / Coincheck 9.94bps. The difference from the primary metric comes from the denominator and reference point (best ask versus mid), and in the formula is roughly half the quoted spread. All levels in this article use the primary metric, measured from the best ask.
At the same size, the deviation varies by venue
At the same order size, median deviation differs by venue. The range across the three (maximum − minimum) widened with size: 7.76bps at ¥10M, 22.34bps at ¥30M, 42.09bps at ¥50M and 108.87bps at ¥100M *1.
| Order size |
Range of the three medians (bps) |
Spread (max − min, bps) |
| ¥10M |
1.48–9.24 |
7.76 |
| ¥30M |
2.89–25.23 |
22.34 |
| ¥50M |
4.35–46.44 |
42.09 |
| ¥100M |
8.61–117.49 |
108.87 |
At ¥10M all three medians are below 10bps, but at ¥100M the spread exceeds 100bps. Even when venue differences are hard to see at small sizes, they open up as size increases.
This article does not use that spread to rank venues or recommend where to execute, for two reasons. Book depth changes over time, and 48 hours of observation is a single sample. And these values are calculated from quotes in the book, not from actual fills. We use the spread only as an indicator that venue differences need checking at each execution size.
How much does the deviation grow when the order is ten times larger?
When the order size rose tenfold from ¥10M to ¥100M, the median deviation from the best ask grew 21.95× on bitbank, 5.82× on bitFlyer and 12.71× on Coincheck *1. The results fall on both sides of proportional (10×): the deviation does not scale in proportion to order size.
There are two ways to calculate the multiple, and this article shows both. The "ratio of medians" divides the ¥100M median by the ¥10M median. The "median within-snapshot ratio" divides each snapshot's ¥100M deviation by the ¥10M deviation from the same book and takes the median of those ratios. Books where ¥10M filled at the first level, giving zero deviation (bitbank 914, bitFlyer 235, Coincheck 45), are excluded from the latter.
| Venue |
Median @ ¥10M (bps) |
Median @ ¥100M (bps) |
Ratio of medians |
Median within-snapshot ratio |
Same, p25 / p75 |
Samples |
| bitbank |
3.67 |
80.66 |
21.95× |
16.45× |
10.39 / 33.00 |
16,360 |
| bitFlyer |
1.48 |
8.61 |
5.82× |
5.78× |
3.81 / 9.96 |
17,039 |
| Coincheck |
9.24 |
117.49 |
12.71× |
12.87× |
9.54 / 17.24 |
17,231 |
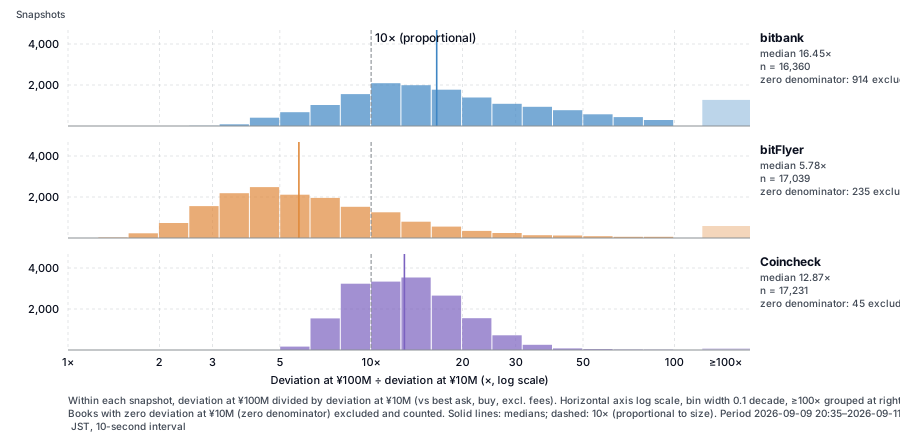
On bitbank the gap between the ratio of medians (21.95×) and the median within-snapshot ratio (16.45×) is the largest of the three, so rather than summarising it as "about 20×", we show both. The ¥10M median is small at 3.67bps, and the spread of that denominator (p25 1.70 / p75 7.28bps) makes the ratio unstable. The within-snapshot ratio also ranges from 10.39× at p25 to 33.00× at p75: on bitbank, the multiple varied widely from snapshot to snapshot.
On this pair, bitbank and Coincheck exceeded 10×. bitFlyer's ratio of medians was 5.82× and its median within-snapshot ratio 5.78×, and even the p75 of its within-snapshot ratio (9.96×) was below 10×. So "the deviation grows faster than linear" is not a conclusion common to all three. What this analysis supports is that the deviation is not proportional to size, and that how it grows splits by venue on either side of 10×.
A multiple above 10× is consistent with a book that is thinner further out relative to its depth near the best quote; one below 10× suggests depth that continues relatively evenly further out. The shape of the book (the size distribution by level) was not aggregated in this analysis, however, so this explanation remains an inference. The multiple was also calculated for only one pair, ¥10M → ¥100M.
The upper limit of what public data can measure
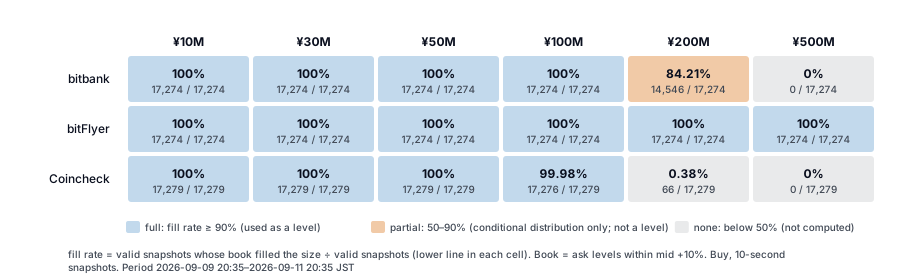
The largest order sizes computable from the public API order book at a 90%+ fill rate were ¥100M on bitbank, ¥500M on bitFlyer and ¥100M on Coincheck *1. The ladder is ¥10M / ¥30M / ¥50M / ¥100M / ¥200M / ¥500M, and the limits are at that granularity. Sizes between ¥100M and ¥200M were not measured.
| Order size |
bitbank |
bitFlyer |
Coincheck |
| ¥10M–¥50M |
100% (17,274 / 17,274) |
100% (17,274 / 17,274) |
100% (17,279 / 17,279) |
| ¥100M |
100% (17,274 / 17,274) |
100% (17,274 / 17,274) |
99.98% (17,276 / 17,279) |
| ¥200M |
84.21% (14,546 / 17,274) |
100% (17,274 / 17,274) |
0.38% (66 / 17,279) |
| ¥500M |
0% (0 / 17,274) |
100% (17,274 / 17,274) |
0% (0 / 17,279) |
Fill rate = filled valid snapshots / valid snapshots. 90% or more is full, 50–90% partial and below 50% none; levels are shown only for full rungs of the ladder *2.
bitbank's ¥200M fit within the returned book in 84.21% of observations, but that is short of 90%, so it is partial and no level is shown. Coincheck's ¥200M is none at 0.38% (66 snapshots). Neither venue filled ¥500M even once. This does not mean "¥200M cannot be executed"; it means the effective price for ¥200M could not be computed in 90% or more of observations from the book the public API returned.
The notional of 200 levels sets the computable limit
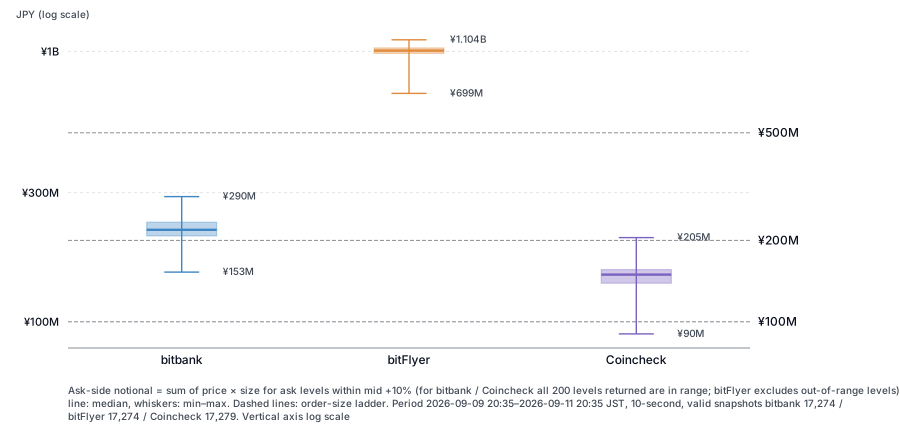
bitbank's and Coincheck's ¥200M fill rates fall short of 100% because in some snapshots the ask-side notional of the 200 levels the API returns (the sum of price × size at each level) is below ¥200M. During the period, bitbank's 200-level ask notional moved between about ¥153M and ¥290M (median about ¥219M), and Coincheck's between about ¥90M and ¥205M (median about ¥150M) *1. Exact figures are in the table below.
| Venue |
Ask levels (as returned by API) |
Ask notional as returned, min / median / max (JPY) |
Ask notional within mid +10%, min / median / max (JPY) |
Median levels excluded |
| bitbank |
200 / 200 / 200 |
152,645,049 / 218,886,381 / 290,322,699 |
Same |
0 |
| bitFlyer |
1,194 / 1,346 / 1,436 |
1,419,073,369 / 1,560,252,611 / 1,670,395,732 |
699,279,859 / 1,007,118,492 / 1,104,065,932 |
428 |
| Coincheck |
200 / 200 / 200 |
90,219,384 / 149,507,654 / 204,789,095 |
Same |
0 |
Distribution over valid snapshots. Levels are min / median / max.
On bitbank and Coincheck, the ask side had exactly 200 levels in every valid snapshot over 48 hours, and no level was excluded for being beyond mid +10% *5. The notional as returned and after exclusion therefore match, and "the 200-level notional is below ¥200M" and "¥200M does not fill" mean the same thing. On bitbank, the 200-level notional exceeded ¥200M in 84.21% (14,546 / 17,274) of snapshots, which is its fill rate. On Coincheck the maximum 200-level notional was about ¥205M, and it exceeded ¥200M in only 66 snapshots (0.38%).
bitFlyer returned 1,194–1,436 levels, of which a median of 428 lay beyond mid +10%. Even after exclusion, its ask notional was about ¥699M to ¥1.104B, and ¥500M filled in every valid snapshot. Reading the notional as returned (median about ¥1.56B) as book depth would include levels outside this article's exclusion rule (mid +10%). The same exclusion is needed whenever public data is used.
Telling "cannot be computed" apart from a thin book
The direct reason bitbank cannot compute ¥200M or more is its public API specification, which returns only 200 levels on each side from the best quote. Whether orders exist beyond the 200th level cannot be observed from the public API, so we cannot conclude that "the book runs out at 200 levels (the book is thin)". Equally, we do not assert that "the book continues beyond the 200th level". That is as far as this analysis goes.
bitbank's API response had exactly 200 levels in all 17,274 snapshots (min = max = 200). That the level count never fell below 200 is consistent with the API truncating at 200. Orders beyond 200 levels, and their sizes, are not in the collected data, however, so this point is an inference.
Coincheck also returned 200 levels in every valid snapshot, but its documentation does not state a level limit. Whether 200 is the API's limit or the end of the book cannot be determined, and levels beyond 200 are likewise unobservable.
bitFlyer filled ¥500M in every snapshot, but the official documentation does not confirm whether the returned book contains every order. A level count varying between 1,194 and 1,436 is consistent with no fixed-depth truncation, but does not show that there is no truncation by price range or similar.
In practice this distinction determines how the estimate is treated. ¥200M and above on bitbank and Coincheck is neither "costly because the book is thin" nor "cheap because the book is deep"; it is a range that "cannot be measured with public data". Extrapolating into it from values up to ¥100M produces numbers without a basis.
Why a single snapshot cannot give you a level
For a ¥100M market buy, the deviation from the best ask moved between p25 and p95 alone from 49.44 to 131.75bps on bitbank, 6.71 to 18.69bps on bitFlyer and 101.45 to 165.13bps on Coincheck — on the same venue, depending on the snapshot. A value read from a single snapshot cannot be used as a level *1. The distribution over 48 hours and 17,274–17,279 snapshots is below.
| Order size |
Venue |
p25 |
Median |
p75 |
p95 |
Maximum |
| ¥50M |
bitbank |
14.89 |
25.45 |
44.34 |
62.86 |
139.14 |
| ¥50M |
bitFlyer |
3.04 |
4.35 |
5.81 |
8.60 |
63.63 |
| ¥50M |
Coincheck |
37.14 |
46.44 |
54.55 |
67.04 |
144.86 |
| ¥100M |
bitbank |
49.44 |
80.66 |
105.49 |
131.75 |
198.56 |
| ¥100M |
bitFlyer |
6.71 |
8.61 |
10.63 |
18.69 |
101.76 |
| ¥100M |
Coincheck |
101.45 |
117.49 |
134.84 |
165.13 |
242.29 |
In bps. Deviation from the best ask. Percentiles by linear interpolation.
The right tail of the distribution is long compared with the median. bitbank's ¥10M had a median of 3.67bps against a p95 of 17.33bps and a maximum of 45.81bps; bitFlyer's ¥100M a median of 8.61bps against a p95 of 18.69bps and a maximum of 101.76bps. The mean exceeds the median on most rungs, but bitbank's ¥100M is an exception, with a mean of 78.64bps below its median of 80.66bps, so this is not generalised to every rung.
Book depth itself also moves from day to day. In a book taken once on 26 August 2026, bitFlyer's ask notional was about ¥1.18B and Coincheck's about ¥230M. Those single observations fall outside the as-returned range of the 48-hour distribution (bitFlyer about ¥1.419B to ¥1.670B, Coincheck about ¥90M to ¥205M) — bitFlyer below it and Coincheck above. That a single observation did not fall within the range of the following 48 hours is an example of why one snapshot cannot be used as a level. The cause of the mismatch (a change in the book or a change on the API side) was not examined.
This is why the article reports medians and percentiles. For estimates, keep a range that includes p25–p75 and p95, not a single median.
What this means in practice
Hold the deviation expected for an execution size as a distribution rather than a single value, and treat sizes the public API cannot measure as "not measurable". Those are the two points to keep in mind when using these results for estimates.
For a ¥100M market buy, the deviation from the best ask was 8.61–117.49bps at the median across the three venues, and 18.69–165.13bps at p95 *1. Raising the order tenfold from ¥10M to ¥100M increased the median deviation 5.82–21.95×. From the public API order book at a 90%+ fill rate, bitbank and Coincheck could be computed up to ¥100M and bitFlyer up to ¥500M.
Steps to check in practice:
- Decide the execution size and check its fill rate — the share of snapshots in which the public API book fills it. On a venue where it sometimes does not fill, the median alone means little
- Estimate from the weighted average price of consuming that size in the book, not from the best quote — at ¥100M the median gap from the best quote is 8.61–117.49bps
- Do not extrapolate from smaller sizes — the ¥10M → ¥100M multiple is 5.82–21.95× depending on the venue, so linearity cannot be assumed
- Check first how much of the book the public API returns — bitbank returns 200 levels each by specification, Coincheck always returned 200 levels in practice, and bitFlyer states no limit. Treat anything beyond the returned range as not measurable
- Look at the distribution over a period, not a single snapshot — bitbank's ¥100M moves from 49.44bps at p25 to 105.49bps at p75
- Add fees separately — the values here are only the deviation from consuming the book
This article covers only the book-based deviation of a single market buy. Cost changes from splitting orders, differences by time of day in Japan and comparisons of domestic and offshore books are each covered in separate articles. It does not recommend which venue to execute on.
The view from Futaba Lab
Compared with traditional financial markets, liquidity and order book depth in crypto markets vary greatly from venue to venue. Executing a large order against only the best quote shown on screen can therefore fill at a considerably worse price than expected.
What matters is not the displayed price itself but the "actually executable price", taking into account how far into the book an order of a given size will reach.
In this analysis too, the deviation of the effective price did not necessarily scale with order size, and changed non-linearly in different ways on each venue. Rather than scaling up the execution cost of small orders to estimate the cost of large ones, it is important to estimate the average fill price for each order size from the actual depth of the book.
Liquidity and spreads also change with market conditions and time of day, so execution cost is not always the same even on the same venue for the same order size.
Given these characteristics, especially for large trades we believe that rather than simply executing a market order all at once, comparing liquidity across multiple venues and splitting orders or adjusting execution timing where necessary is important for achieving better execution prices.
At Futaba Lab, we aim to achieve best execution measured by actual execution cost rather than displayed prices, by evaluating book depth, order size and market conditions together.
Limitations of this analysis
- The observation is a single 48-hour weekday window. It covers 9–11 September 2026 (Wednesday to Friday) and does not include weekends, month-ends or periods of high volatility. Day-to-day differences between the two days were not aggregated, and the 48-hour medians cannot be read as long-run levels
- Values are calculated from quotes in the book, not from actual fills. Hidden liquidity (such as iceberg orders), changes in the book before an order arrives and an order's own impact on the book are not included. Agreement between book-based values and actual execution cost was not tested. The collection interval is 10 seconds and the book changes faster than that, so snapshots are samples of the book's state
- Only buys (consuming asks) were calculated; sells were not. Fees are not included. Total cost including fees is outside the scope of this article
- bitbank missed 4 cycles (65.2 seconds) during the observation (coverage 99.98%). For bitFlyer, 5 crossed books were excluded as invalid. Neither was filled in. Times and details are in the notes *3
- Levels beyond the 200th on bitbank and Coincheck cannot be observed from the public API, so the existence of orders there cannot be asserted. bitFlyer states no level limit, and whether the returned book contains every order cannot be confirmed. Whether the REST API and the Realtime API return the same depth was not tested
- The level exclusion threshold (mid ±10%), fill rate rule (90%+ is full) and minimum sample size of 21 are the same as in the separate article on round-trip effective spreads. Sensitivity to these thresholds was not measured. Changing them could change bitFlyer's within-mid +10% notional and its ¥500M fill rate. bitbank and Coincheck are unaffected, as no levels were excluded
- The non-linearity measure covers only one pair, ¥10M → ¥100M. Multiples for other pairs were not calculated. The mechanism behind differences in the multiple (the shape of the book) was not aggregated, and the explanation in the text is an inference. The "ratio of medians" and the "median within-snapshot ratio" differ, most of all on bitbank (21.95× / 16.45×), so both are shown
- Only bitFlyer has an official basis for its rate limit. The documentation for bitbank's and Coincheck's public APIs states no rate limit, and bitbank's support FAQ could not be retrieved (HTTP 403). We did not try extending depth with parameters such as
limit, use WebSocket, or contact the venues
- The three venues' raw data were not independently re-verified for this article. We rely on a full-row validation of the original dataset (verdict WARNING) and hash matching of the copied files (147 / 147 matched) *4
- Where to find the raw data and aggregated results is not published here. The raw data are order book snapshots from the three venues' public APIs, aggregated in code, but this article does not give readers steps to recompute its figures from the same data
What cannot be concluded
Within the scope of this analysis, the following cannot be concluded.
- The fill price and fill rate of an actual market order — values are calculated from quotes in the book; no execution history was collected
- The effective price of ¥200M or more on bitbank and Coincheck — bitbank's fill rate is 84.21% at ¥200M and 0% at ¥500M; Coincheck's is 0.38% at ¥200M and 0% at ¥500M. Outside the range the public API returns
- Whether orders exist beyond the 200th level on bitbank and Coincheck — not observable from the public API. For Coincheck, it also cannot be determined whether 200 levels is the API limit or the end of the book
- Whether bitFlyer's book contains every order — no level limit is stated, and nothing says the full book is returned
- "On all three venues, deviation grows faster than linear" — bitFlyer was 5.82× from ¥10M to ¥100M (below 10×). What can be said is that it is not proportional and splits on either side of 10×, and that bitbank and Coincheck exceeded 10× on this pair
- bitFlyer's multiples from ¥100M to ¥200M and from ¥200M to ¥500M — not calculated
- The mechanism behind differences in the multiple — the shape of the book (size distribution by level) was not aggregated
- Deviation by time of day, day of week, at weekends or in high volatility — time-of-day breakdowns were not used in the conclusions, and weekends and high-volatility periods are not in the observation. Time-of-day differences are the subject of a separate article
- Total cost when splitting an order — only single market orders were calculated. The subject of a separate article
- Whether the 48-hour levels hold over the long run — a single observation. A one-off observation on 26 August 2026 fell outside the 48-hour range
FAQ
Q. How does the best quote differ from the price at which a large order actually executes?
The best quote is the price of the single top level of the book. A market order consumes that level and then moves on to the next. The fill price of a sizeable order is the weighted average of the levels consumed, which is worse than the best quote. In this analysis, the median gap between that weighted average and the best ask for a ¥100M market buy was 8.61–117.49bps across the three venues *1. The concepts are covered in a separate article.
Q. If the order is ten times larger, how much larger is the deviation?
From ¥10M to ¥100M, the median deviation from the best ask grew 21.95× on bitbank (median within-snapshot ratio 16.45×), 5.82× on bitFlyer (5.78×) and 12.71× on Coincheck (12.87×) *1. The results fall on both sides of proportional 10×; it does not scale proportionally. Multiples for other size pairs were not calculated.
Q. Up to what size can public data confirm order book depth?
The largest sizes computable from the public API order book at a 90%+ fill rate were ¥100M on bitbank, ¥500M on bitFlyer and ¥100M on Coincheck *1. The ladder is ¥10M / ¥30M / ¥50M / ¥100M / ¥200M / ¥500M. On bitbank and Coincheck some snapshots had a 200-level notional below ¥200M, giving ¥200M fill rates of 84.21% and 0.38%. This limit does not mean the book is thin; levels beyond the 200th cannot be observed from the public API.
Q. How much does the deviation differ by venue?
The spread of the three venues' medians (max − min) at the same size was 7.76bps at ¥10M and 108.87bps at ¥100M *1. It widens as size increases. This article does not use the spread to rank or recommend venues.
Q. How does the deviation change by time of day?
This article does not draw a conclusion. Time-of-day analysis is covered in a separate article. The values here are the distribution over the full 48 hours.
Notes
*1 Calculation conditions. Covers the BTC/JPY spot order books of bitbank / bitFlyer / Coincheck. Direction: market buys only (consuming the ask side from the cheapest level). The effective price is the weighted average price of consuming the order amount, and the deviation is in bps from the best ask. Fees excluded. Period 2026-09-09 20:35:56 – 2026-09-11 20:35:46 JST (47.997 hours common to all three, Wednesday evening to Friday evening), 10-second interval, valid snapshots bitbank 17,274 / bitFlyer 17,274 / Coincheck 17,279. Statistics: median, p25, p75, p95 and maximum (percentiles by linear interpolation). bps and multiples rounded to 2 decimal places.
*2 Fill rate and display rules. Fill rate is the share of snapshots in which the returned book (after exclusions) reached the order amount. 90% or more is full and a deviation value is shown; 50–90% is partial and only the fill rate is shown; below 50%, no value. No value is shown for fewer than 21 samples. Values from books that do not fill are not included in the distribution. The rules are the same as in the separate article on domestic and offshore round-trip effective spreads.
*3 Gaps and exclusions. bitbank missed 4 cycles (65.2 seconds) between 05:42 and 05:43 JST on 2026-09-11, with 17,276 rows collected and coverage of 99.98%; the gap was not filled. Of the 4 cycles, 1 was recorded as an error (timeout) and the other 3 were dropped by the collector as cycle delays, so the number of recorded errors does not match the number of missing cycles. bitFlyer had 5 crossed books (best bid at or above best ask) between 04:10 and 04:11 JST on 2026-09-11, excluded as invalid. Coincheck had no gaps or invalid books. None of the three had corrupt rows or duplicate timestamps. All of this matches the findings of the full-row validation of the original dataset (verdict WARNING).
*4 Source of the raw data and choice of the three venues. The raw data are a copy of the bitbank / bitFlyer / Coincheck portion (147 files, 51,836 rows) of the collection job (10-second interval × 48 hours) for a separate article on domestic and offshore round-trip effective spreads; hash matching on copying matched 147 / 147 files. The three venues' data were not independently re-verified for this article, which relies on the full-row validation of the original dataset. The three venues were fixed at the time of this article's preliminary observation (2026-08-26), not chosen on the basis of the separate article's results for ten domestic venues or any ranking of book depth. All aggregation was done in code, with no hand-written figures.
*5 Level and book exclusion rules. Levels more than ±10% from mid (the midpoint of the best bid and best ask) are excluded and counted. Zero-size levels are dropped and counted. Books that are crossed (best bid ≥ best ask), have a quoted spread above 1,000bps, have an empty side or contain non-finite values are excluded as invalid. The thresholds are the same as in the separate article; none were created specifically for this article.
Disclosures
Futaba Lab and its affiliates trade on their own account in digital asset markets. The analysis in this article concerns market structure within the scope of what can be disclosed, and does not represent the trading strategies, positions, execution methods or execution venues of the company or its affiliates.
This article is provided for informational purposes and is not a recommendation to execute on any particular venue or to acquire or dispose of any financial instrument. The raw data in this article were obtained from the venues' public APIs and do not include the company's trading data. Investment decisions are your own responsibility.
