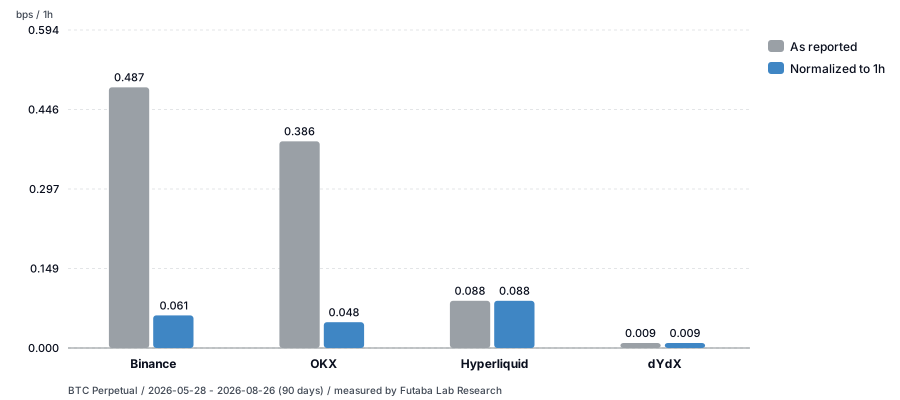
Funding intervals differ by venue, so averaging the rates returned by each exchange API is not a comparison. Across four BTC Perpetual venues over 89.7 days, the spread between venue averages was 51.7x as reported and 9.4x once normalized to a 1-hour basis, and the ranking changed.
01Funding intervals differ by venue, so averaging API values as reported is not a comparison of hourly cost
02Across four BTC Perpetual venues over 89.7 days, the spread between venue averages was 51.7x as reported and 9.4x after normalizing to 1 hour
03The ranking changes after normalization - Hyperliquid moves from third to first
04Aligning the interval does not remove the differences between venues (0.0788 bps/h remained between two 1-hour venues)
05A unit mismatch cannot be detected as an outlier, so the interval check has to be part of the aggregation itself
How this article defines the funding rate
The funding rate discussed here is the rate applied at each funding settlement, as returned by each venue's funding rate history API. Predicted funding and annualized figures shown in exchange interfaces are out of scope.
Funding is not a fee the venue charges its users. In principle it is a transfer between longs and shorts. This article refers to the cycle of those payments as the funding interval.
The terms are distinguished as follows.
Term
Meaning in this article
Funding rate
The rate applied to one funding settlement period
As-reported rate
The rate returned by a venue's funding rate history API, unchanged
Normalized rate
The rate converted to a 1-hour basis (simple, non-compounding) to absorb differences in interval
Venue average
The average of the normalized rates for a venue over the observation period
Simple cumulative funding rate
The rates summed as they are over the period. This is not an amount paid
Why funding rates cannot be compared as reported
A funding rate is obtained as the rate applied to one settlement period. Placing values from venues with different intervals side by side does not align the time axis.
Funding intervals differ by venue
In the official documentation we reviewed, Binance and OKX settle funding every 8 hours by default [1][2], while Hyperliquid and dYdX settle every hour [3][4] (as of writing).
In a market that settles hourly, the rate per settlement is one eighth of that of an 8-hour market even when the hourly cost is identical. That is a difference in the time axis, not in the state of the market.
Generalizing to "Binance is 8 hours" is also inaccurate at the venue level. Binance's official documentation states that the interval can be 4 hours or 1 hour depending on the instrument, and that the interval itself may be changed during extreme market conditions [1]. OKX likewise has 1-, 2- and 4-hour settings depending on the contract [2]. This has to be checked per instrument and per contract.
The basis for calculating funding payments also differs
The price used to value a position when calculating the funding exchanged also differs by venue.
Binance and OKX use the mark price [1][2]. Hyperliquid's official documentation states that it converts positions to notional using the spot oracle price rather than the mark price [3]. dYdX uses the oracle price / index price as its basis [4].
We have not, however, measured how much this difference in reference price affects the effective cost. We confirmed that the difference exists; its impact in monetary terms is not something we can conclude at this point.
Conditions to align before comparing
Three conditions have to be aligned.
Time unit - normalize to a common unit, such as a 1-hour basis
Observation period - truncate to the period common to every venue
Conversion method - if annualizing, state whether it is simple or compounded
The normalization itself is straightforward. Multiply the as-reported rate by the target duration divided by the funding interval. A 0.01% rate on an 8-hour interval becomes 0.00125% on a 1-hour basis.
Whether annualization should be simple or compounded is a large enough topic on its own that this article does not address it. When referring to an annualized figure, check which convention produced it.
Data and analysis conditions
The figures in this article are measurements taken by Futaba Lab from each venue's public API.
Each venue's funding rate history API (no authentication required)
Normalization
1-hour basis, simple
Not included
Trading fees, slippage, cost of capital on margin, and similar
The venues were not selected by open interest or volume. They were selected so that venues with an 8-hour funding interval and venues with a 1-hour interval were both present. The subject of this article is the difference in interval, and a set of venues sharing one interval cannot demonstrate it.
Rather than assuming the documented intervals, we measured them from the median spacing of the timestamps in the retrieved data. The results matched each venue's documentation.
What normalization changes in the comparison
That intervals have to be aligned is widely understood among practitioners who work with derivatives. What this analysis shows is how far the result moves when that step is missing from the processing.
Averaging the rates retrieved from each API as they are produces the "as-reported average" column below. Where retrieval and aggregation are automated, or where a large language model is asked to handle both, this is the column that comes out as the comparison unless the interval check is part of the processing.
This error is not detectable as an anomaly in the values. Each venue's officially published figures are being averaged as published, so there are no out-of-range values and no gaps.
Comparing the venue averages over the period, the largest and smallest differed by a factor of 51.7 as reported. After normalizing to a 1-hour basis, that ratio narrowed to 9.4.
The ranking also changes. Hyperliquid, third as reported, is first once normalized to a 1-hour basis.
Venue
Interval
As-reported average
1h-normalized average
Binance
8h
0.4872 bps
0.0609 bps
OKX
8h
0.3864 bps
0.0483 bps
Hyperliquid
1h
0.0882 bps
0.0882 bps
dYdX
1h
0.0094 bps
0.0094 bps
Normalization divides the 8-hour venues by eight, while the 1-hour venues are unchanged. That gap is what reorders the ranking.
The as-reported ranking does not match the ranking by hourly cost
We split the period into 30-day windows, shifting the start date by one day at a time to produce 60 windows, and recalculated the venue averages in each.
The as-reported ranking was identical across all 60 windows. The leader after normalizing to a 1-hour basis was also identical across all 60. And the two differed in all 60.
A stable ranking from a consistent method is still not a valid comparison of hourly cost if the unit is not aligned. The as-reported ranking is correct as a ranking of the rate per funding settlement; it does not coincide with the ranking by hourly holding cost.
Checking that a result reproduces does not surface a unit mismatch. Repeating the same processing returns the same error, so the more the aggregation is automated, the longer the error persists. It surfaces only when the interval check is built into the aggregation itself.
Differences between venues remain after normalization
Normalization does not level out differences between venues. It removes a mismatch in the time axis.
In this analysis, Hyperliquid and dYdX both settle funding hourly, and a difference of 0.0788 bps/h remained between their 1-hour averages. Hyperliquid was first after normalization; dYdX was last both before and after.
This means that for a venue with a small as-reported rate, two situations cannot be told apart:
The level of funding is genuinely low (dYdX)
The interval is short, so the rate per settlement is small (Hyperliquid)
Which of the two applies cannot be determined until the figures are measured in a common unit.
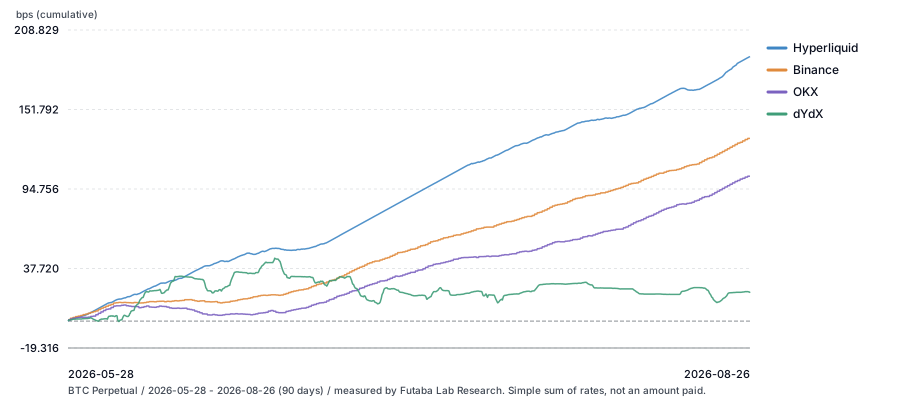
Simple cumulative funding rate over the period
Summing the funding rates over the period as they are, the highest of the four venues was 1.90% (Hyperliquid) and the lowest 0.20% (dYdX), a difference of 1.7%.
This figure is a simple cumulative funding rate. It is not the funding that would actually be paid on a given size of BTC position. The amount paid depends on the notional value of the position, and the reference price used for that valuation moves at each settlement. Its definition also differs by venue [1][2][3][4].
Over a holding period of 89.7 days, the difference between venues accumulated to more than 1%. For cost comparisons over long holding periods, funding warrants evaluation as a cost item in its own right.
Checking this in practice
Four things to check when comparing funding across venues.
Confirm each venue's funding interval per instrument and per contract - a venue-level generalization is not enough
Normalize to a common time unit - 1-hour or 8-hour both work. What matters is that they match
Truncate to the period common to every venue
If using an annualized figure, confirm whether it is simple or compounded
The same applies to third-party comparison tables and aggregation services: check whether their aggregation went through these steps.
The view from Futaba Lab Research
The funding rate history itself is available from the public APIs of all four venues. Bringing several venues into a comparable state, however, requires additional processing to align intervals, periods and contract specifications.
A normalized funding rate is not a conclusion in itself; it is the precondition for one. Deciding which futures to carry, or whether an arbitrage on funding differences between venues could hold, is not possible without data that has been brought into a comparable state. What this article sets out is how to build that starting point. It does not address individual trading conditions or whether such trades would be viable.
At Futaba Lab Research we treat data normalized to a comparable state, rather than the retrieved figures themselves, as the object of analysis.
Limitations of this analysis
The period covered is the 89.7 days from 2026-05-28 to 2026-08-26. This analysis supports no conclusion about behaviour beyond that period. The ranking shown is a measurement of the period covered and does not indicate future rankings.
Only four BTC instruments were covered. Binance and OKX use different funding intervals depending on the instrument and contract, so the picture may differ for other instruments.
We confirmed in the official documentation that the basis for calculating funding payments differs by venue, but we did not measure how much that difference affects the effective cost.
The simple cumulative funding rate in this article is the sum of the rates as they are. It is not the funding that would be paid on a given size of BTC position. Calculating that requires a separate simulation of size x reference price at each settlement x funding rate.
The figures exclude trading fees, slippage, the cost of capital on margin, and similar items.
The venue specifications referenced here are as of writing. Specifications change, so confirm them as of the date you rely on them.
FAQ
Q. Does it have to be a 1-hour basis?
No. An 8-hour or daily basis works as well. The requirement is that every venue is converted to the same unit. This analysis chose 1 hour because it is the shortest funding interval among the venues covered.
Q. How long an observation period is needed?
That depends on the purpose of the comparison. For a use case that acts on near-term funding differences, an observation of hours or days may be appropriate. This article used roughly 90 days so that a short-term skew in funding would not drive the conclusion.
Q. Is an as-reported comparison never usable?
Between venues that share a funding interval, the ranking of as-reported rates does coincide with the ranking by hourly cost. The problem arises when venues with different intervals are mixed. If you first confirm that the intervals match, the as-reported figures can be enough.
Q. Why not select the venues with the largest open interest or volume?
Because the subject of this article is the difference in funding intervals. Venues sharing one interval cannot demonstrate the need for normalization. The selection deliberately mixes 8-hour and 1-hour settlement.
Disclosures
Futaba Lab and its affiliates trade on their own account in digital asset markets. The analysis in this article concerns market structure within the scope of what can be disclosed, and does not represent the trading strategies, positions or execution terms of the company or its affiliates.
This article is provided for informational purposes and is not a recommendation to acquire or dispose of any financial instrument. Investment decisions are your own responsibility.
A funding rate combines a premium and an interest component joined by a clamp. While the premium stays in range, the output is just the interest component. Over 2,005 hours of Hyperliquid's BTC Perpetual, this held for 1,086 hours (54.2%), when the rate carried no supply-and-demand signal.
·12 min read·加藤 豪輝
Futaba Lab
Trading and Execution
How far does the effective price move on a large BTC order? — What public data can measure
Measured on the BTC/JPY order books of three Japanese venues (bitbank / bitFlyer / Coincheck) over 48 hours. For a ¥100M market buy, the median gap from the best ask was 8.61–117.49bps; a 10× larger order raised it 5.82–21.95×. How far the public API can price also differs by venue.
From 18 SEC filings and regulator publications. Whether the official holder record sits on-chain or with the transfer agent differs by issuer, yet in all three entities examined the issuer or its agent controlled changes to it. Where the record sits and who controls it must be checked separately.